Question
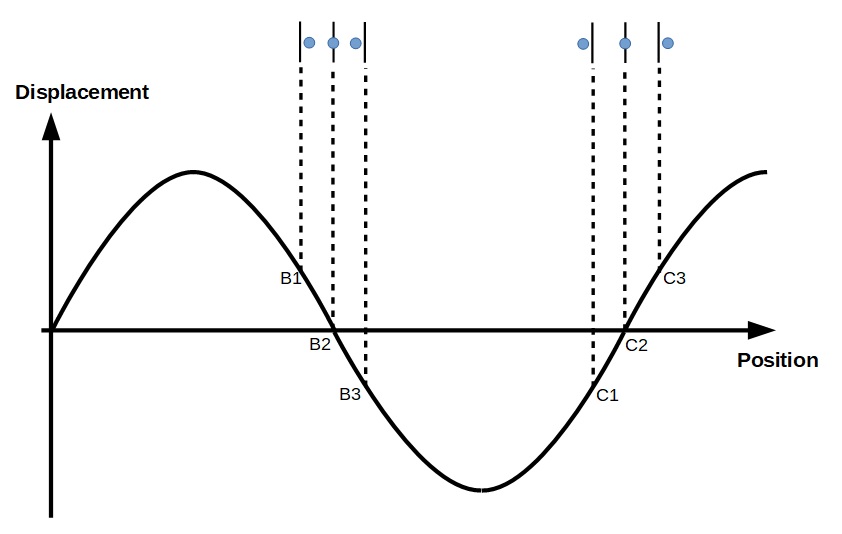
A displacement against position graph for a longitudinal wave is shown below. Which points represents the compressions and rarefactions?
Answer
For the graph, the position axis represents the location of the equilibrium position of a particle. The displacement axis gives the displacement of the particle from its equilibrium position. For this question, we assume that positive displacement is towards the right.
For example, in the graph below, Particle A has a equilibrium position at 0.80 m and it is displaced 1.5 mm to the right of its equilibrium position.
We can show the displacement on the graph:
The displacements of B1, B2, B3, C1, C2 and C3 are shown.
Hence, B2 is the compression and C2 is the rarefaction.


